


.webp)

Global market summary in Q1 2026
The first quarter of 2026 began with strong momentum carried over from late 2025, as global stocks advanced on the back of robust earnings and continued growth around AI. Corporate results broadly exceeded analysts expectations, reinforcing confidence in productivity gains tied to AI adoption and supporting elevated valuations across major stock markets.
However, sentiment shifted sharply in February as technology stocks led a market selloff. Concerns emerged over the pace of AI advancement, particularly following breakthroughs from Anthropic, which intensified fears of disruption across multiple industries. Investors began reassessing the durability of Software as a Service (‘SaaS’) business models in industries like legal, IT, marketing and data analytics, driving a rotation away from the technology sector.
In March, geopolitical risk added further volatility in markets. The US and Israel launched a joint military operation, “Epic Fury”, targeting key Iranian sites. The escalation triggered a significant energy shock, with Brent crude prices surging from $67 to $119 per barrel, amplifying inflation concerns and unsettling global markets.
How did global stock markets perform in Q1 2026?
Global stock markets delivered a volatile but resilient performance in Q1 2026, balancing strong earnings momentum against rising macro and geopolitical risks. While AI-related optimism continued to support valuations, sharp rotations especially in technology, highlighted growing sensitivity to disruption in geopolitical and inflationary concerns. Oil prices spiked and shifting rate expectations further contributed to uneven returns across regions and sectors.
All of PensionBee’s portfolios are invested in the following regional markets through underlying ETFs. For a detailed breakdown of sub-ETFs in each portfolio, click “View detailed asset allocation” of the portfolio on our investments page.
Please note that the market index serves as a benchmark for reporting purposes and doesn’t mean PensionBee’s funds are directly invested in that index.
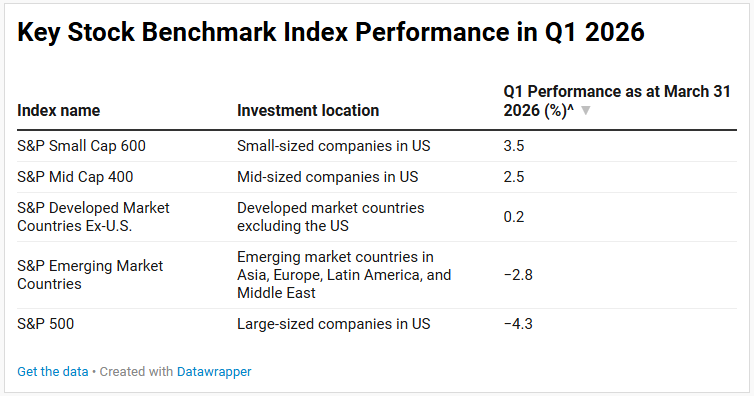
In Q1 2026, US small and mid-caps outperformed, with the S&P Small Cap 600 and Mid Cap 400 returning 3.5% and 2.5%, respectively. This was driven by a selloff in large-cap tech's AI/SaaS stocks, which weighed on the S&P 500, so indices with small and mid-cap companies, with less tech exposure and higher weights in industrials, financials, and real estate, proved more resilient. A rotation toward value, especially the energy sector, further boosted returns. Despite geopolitical tensions and rising oil prices, small caps benefited from their greater exposure to energy-related sectors.
Developed markets saw modest 0.2% gains (S&P Developed Market Ex-US) as a March oil price driven selloff and inflation concerns weighed on Europe and Asia. The UK remained relatively stable due to its large energy sector exposure. Japan stood out, with stocks gaining from positive sentiment around elections, corporate reforms, and strong earnings expectations.
Emerging markets and the US declined 2.8% and 4.3%, respectively. Emerging markets were pressured by Asia’s heavy reliance on Middle Eastern energy imports, with the Strait of Hormuz closure driving oil prices higher and raising inflation and economic growth risks. Tech-heavy markets like Taiwan also fell amid the AI and SaaS selloff, amplifying losses.
In the US, mega-cap tech losses were a key drag, as the tech selloff within software and communication sectors intensified, while the oil supply shock elevated inflation concerns and broader stock market pressure.
^ All indices are reported in USD.
Q1 26 was shaped by two distinct shocks that hit different parts of the market at different times. The AI/SaaS disruption in late February struck the S&P 500 significantly due to its mega-cap tech concentration, leaving it with minimal gains to lose by March. When the Middle East conflict and oil shock arrived, it was the indices that had surged most through February (emerging markets, mid-cap, and developed market ex-US) that suffered the sharpest reversals, driven by Asia’s energy dependency on the Middle East, inflationary concerns, and flight to safer sectors. The result is that the S&P 500 posted the worst final return but experienced the smallest March reversal, while emerging markets experienced the largest price fluctuations within the month.
How did US bond markets perform in Q1 2026?
The US bond markets weren’t an exception to the bumpy ride in the first quarter. Despite dispersion in performance across different types of bonds, overall gains were generally modest.
The key driver for the bond market's movement was uncertainty in the Middle East, leading to disruptions in the oil supply chain, which is highly linked to the short-term inflation rate. Additionally, this overshadowed the earlier expectation among investors for a further interest rate cut by the Federal Reserve (the ‘Fed’) in early 2026.
The US bond market saw shorter-term government bonds ('Treasuries’) outperform their longer-dated counterparts in the first quarter. The Bloomberg 1-3 Year U.S Treasury posted a 0.3% gain. Conversely, the Bloomberg Long U.S Treasury saw a negative return, falling by 0.4% over the same period. This divergence in performance is also reflected in the yield movements, with the yield on the US 10-year Treasury rising from 4.0% to 4.4%.
The worst performers were the US corporate bonds, with the S&P US High Yield Corporate Bond down 0.5%. This was because a mixture of rising Treasury yields, widening credit spreads, and inflation fears driven by the oil supply disruptions in the Strait of Hormuz all eroded the risk appetite from investors.
Overall, US bonds delivered a mixed but largely disappointing quarter, with rising yields, driven by persistent inflation risk. Long-term Treasuries and high-yield corporates were the hardest hit, while short-term Treasuries posted modest gains.
Market Summary Disclaimer:
This data/research/content is provided solely for informational and educational purposes. PensionBee Inc. does not make any representations or warranties as to the accuracy, timeliness, suitability, completeness, or relevance of any information prepared by any unaffiliated third party, whether linked to PensionBee Inc.’s website or incorporated herein, and takes no responsibility therefore. Nothing presented here constitutes tax, legal, financial or investment advice. This information does not take into account the specific financial, legal or tax situation, objectives, risk tolerance, or investment needs of any individual investor. This research and analysis is based on a synthesis of both publicly available information (regarding the global stock markets, US bond indices, and market commentary) and proprietary, private research (regarding PensionBee Portfolios). This combined approach ensures the depth of our findings, though the views expressed do not incorporate or rely upon any confidential client data. Any data, statistics, or third-party sources referenced are for educational purposes only and should not be relied upon as sole decision-making tools. This information, and any associated customer testimonial or third party endorsement does not constitute an offer, solicitation, or recommendation to buy or sell any securities or investments. Investing involves risk.


